We developed the following modules for this project:
Pictures of the installation:
-
This screen shows a picture of the installed solar panels.
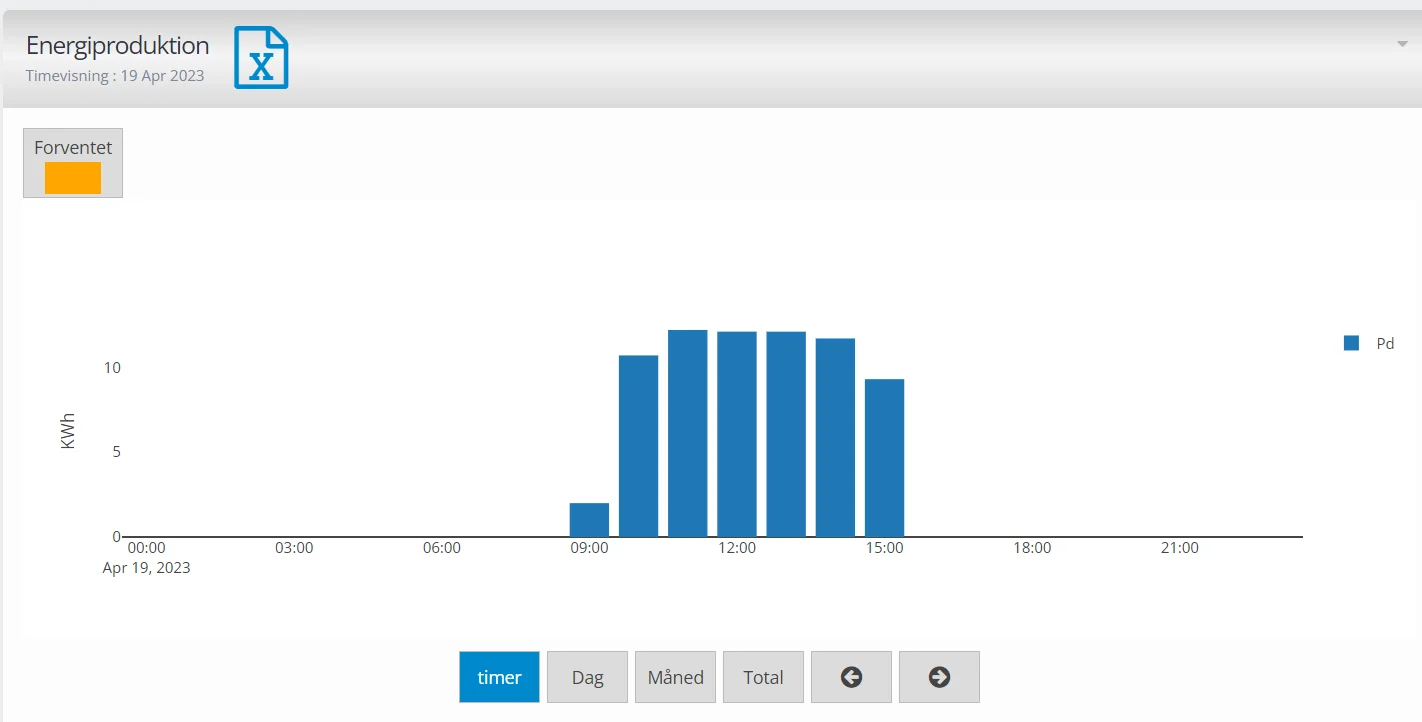
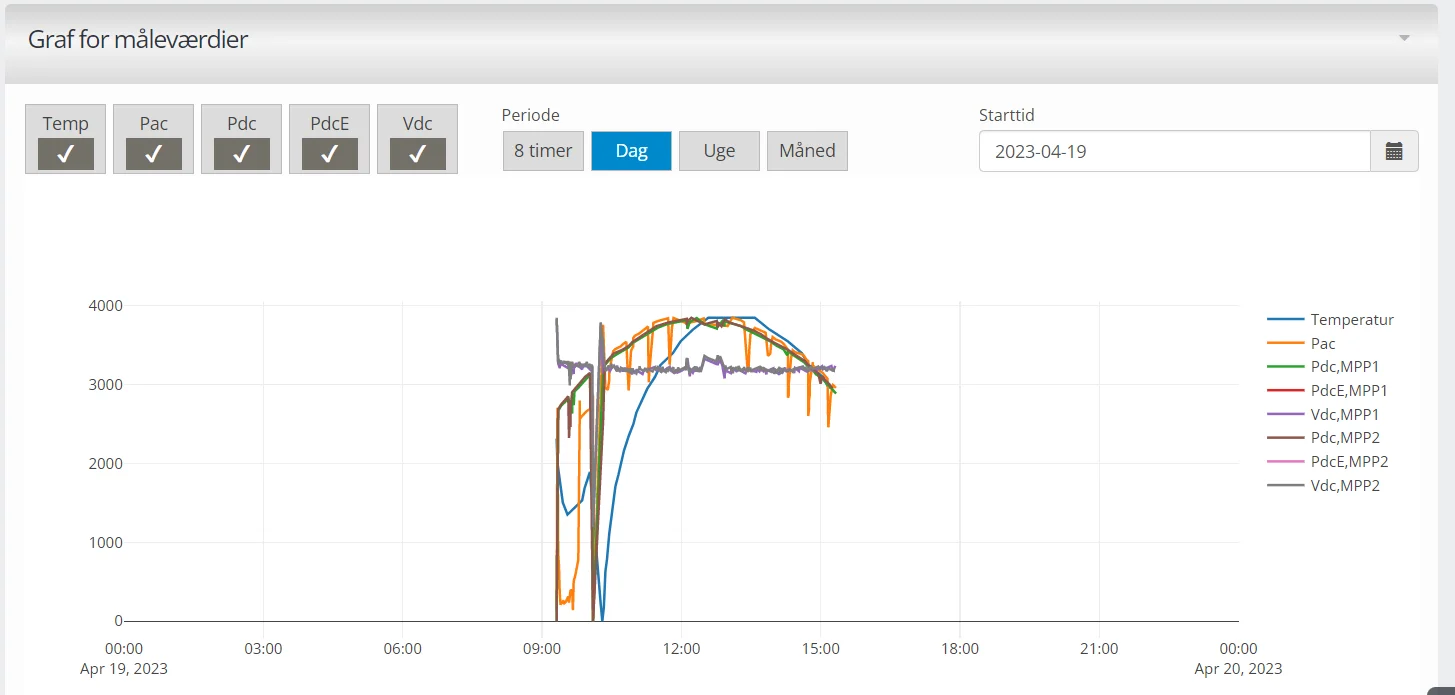
Energy production
-
On this screen, the user can check the overall power generated by the solar panels.
-
Users can calculate the overall power generated by the solar panels per hour, per day, per year, and the total power generated to date.
Inverter Status
This segment is divided into four different parts:
-
The first part shows the Number of inverters working in the system/the total number of inverters installed in the system.
-
The second panel shows the number of MPPs running/total number of MPP installed.
-
The third panel shows the stopped inverter/total number of inverter.
-
Fourth-panel show the number if inverter will error/total number of inverters installed in the system
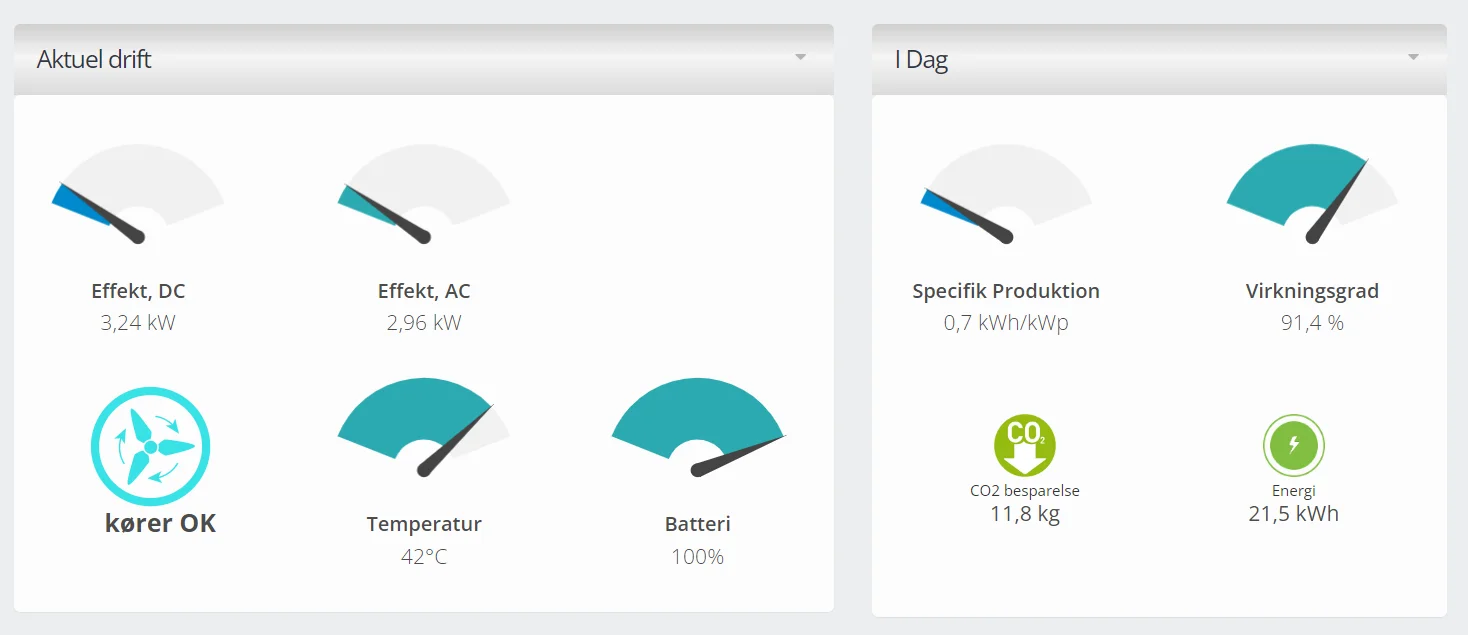
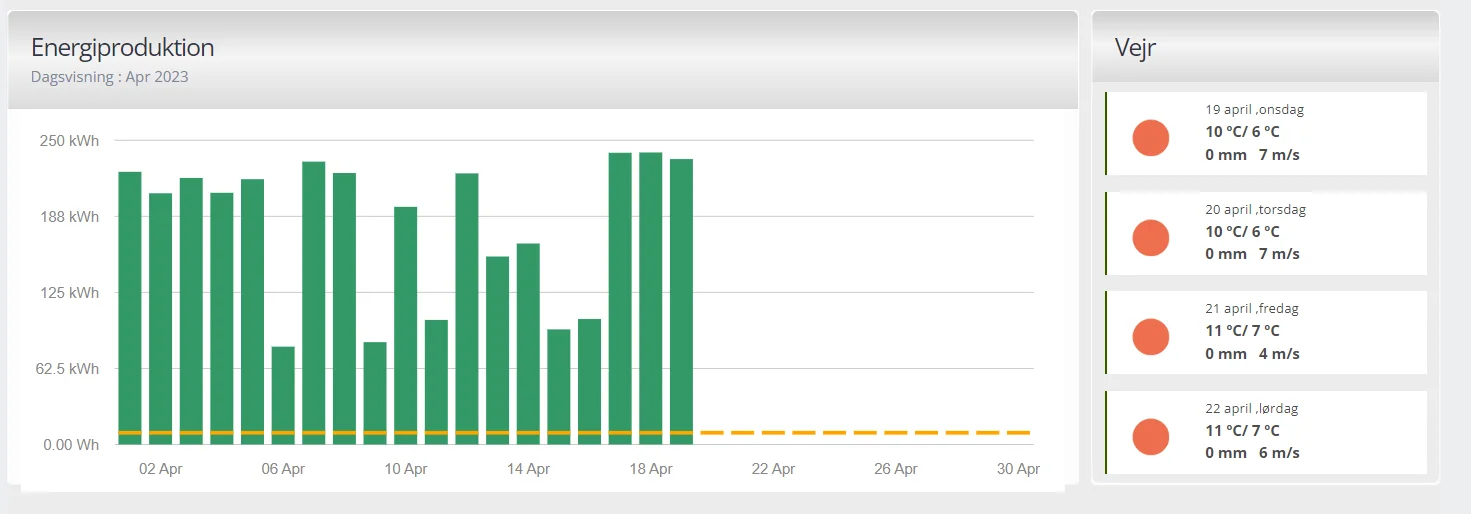
Production
The production screen shows the overall power produced by the solar panels.
CO2 saving
This panel shows the amount of CO2 emissions saved by the generation of solar power.
Energy production MPP
Here, MPP stands for "maximum power point." The maximum power point is the point on the current-voltage curve of a solar panel at which it is operating at its maximum power output.

 Mean Stack Development
 Vue JS Development
 Javascript Development
 React JS Development
 Angular JS Development
 Next JS development
 Java Development
 Python Development
 Django Development
 Cherrypy Development
 C# Development
 ASP.NET Development
 NodeJS Development
 Laravel Development
 CodeIgniter Development
 Zend Development
 Ruby on Rails Development
 CakePHP Development
 PHP Website Development
 Symfony Development
 Drupal Development
 Joomla Development
 Wordpress Development
 .NET Nuke Development
 Kentico
 Umbraco
 .NET MAUI Development
 Xamarin Application Development
 iOS Application Development
 Android Application Development
 Android Wear App Development
 Ionic Development
 Universal Windows Platform (UWP)
 Kotlin Application Development
 Swift Application Development
 Flutter Application Development
 PWA Application Development
 Offshore Software Development
 Custom Application Development
 Front-End Development
 Full Stack Development
 AI & Machine Learning
 Custom CRM Solutions
 Flask Software Development
 Electron JS Development
 ChatGPT Development
 Magento Development
 Magento 2.0 Development
 Magento Enterprise
 Shopping Cart Development
 Prestashop Development
 Shopify Development
 Open Cart Development
 WooCommerce Development
 BigCommerce Development
 NopCommerce Development
 Virto Commerce Development
 AspDotNetStorefront Development
 RaspBerry Pi
 Firmware Software Development
 ESP 32 Software Development
 Embedded Development
 Internet of Things
 Nordic Development
 .NET Application Development
 Microsoft Dynamics CRM
 VB .NET Development
 Sharepoint Migration
 ASP.NET Core Development
 ASP.NET MVC Development
 AJAX Development
 Agile Development
 Microsoft Bot
 Microsoft Blazor
 Microsoft Azure Cognitive
 HTML 5
 UI/UX Design
 Graphic Design
 Adobe Photoshop
 XML Application Development
 Cloud Computing Solutions
 Azure Cloud App Development
 AWS Development
 Google Cloud Development
 SQL Programming Development
 MySQL Development
 MongoDB Development
 Big Data
 Robotic Process Automation
 Social Media Marketing
 Search Engine Optimization
 QA Testing
 Software Testing
 Software Security
 Maintenance And Support
 I.T. Consulting Services
 Business Intelligence
 YII Development
 Data Analysis
 Alexa Skills Development
 On Demand App for Mobile repairing services
 On Demand App for Car Service Booking
 On Demand App for Cleaning Services
 On Demand App for Pharmacy
 On Demand Dedicated Developers